Which US airlines were less delayed?

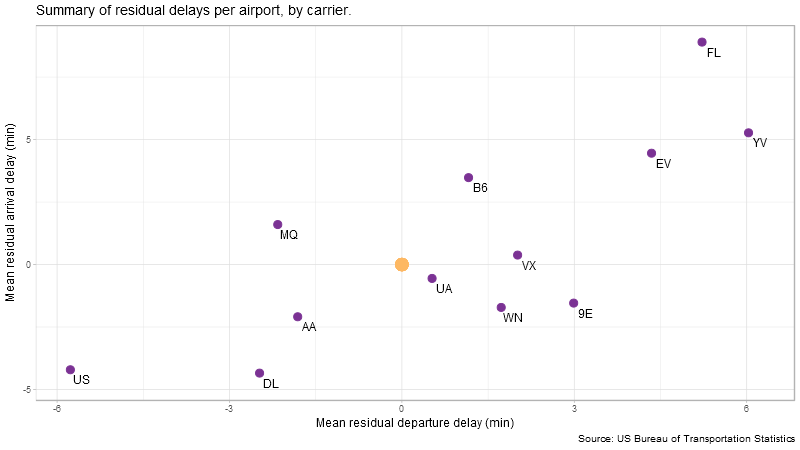
Residuals of arrival and departure delays for flights departing from NYC in 2013, as calculated by (mean carrier delay per destination) - (mean airport delay). This is done to disentangle the influence of good/bad airports on delays.
Each point represents a specific airport destination for that carrier. Lower values are better.
A summary of the above chart using weighted means is below.
Main tools used: R, tidyverse + nycflights13 data package
How they were used: I explored, filtered, transformed, and visualised the data. Particular filters used include
- Removing cancelled flights
- Removing destinations visited by less than 3 carriers (improving the residual plot)
- Removing carrier-destination pairs which occurred 10 or less times in the original data (improving the plot as many of these had extreme residuals). With these gone the mean tally went from
1258to1446.